This guide will help you learn how to debug your Shipping Integration Plugin's code when it is running in boxwise. If you haven't deployed your project and tested your project yet first follow the steps in these articles: Deploying your project to boxwise and Testing your project in boxwise.
Index
Before you begin
Local debugging
Remote debugging
Summary
Before you begin
Before you start with this guide make sure you have:
- installed an IDE like VS2019 or Jetbrains Rider
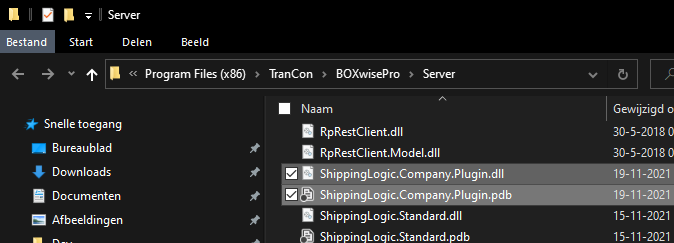
- built a Debug(❗) build of your code and you deployed both your .dll file and your .pdb file to the boxwise installation directory
- have not changed your code since you deployed your files to boxwise and started boxwise. (💥 If you change your code after deploying it your deployed pdb won't match correctly with your actual code's line numbers and it will give you very weird debugging results.)
Sample of the .dll and .pdb files deployed in the boxwise installation directory
Local debugging
Start boxwise
To debug your code in needs to be executed. Boxwise is responsible for executing your code so to debug in you first need to run boxwise.
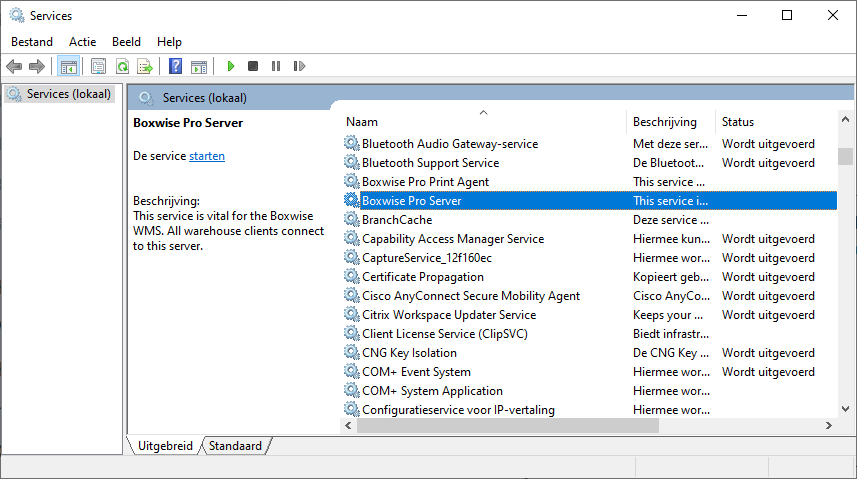
- Run boxwise either as a service (
Wms.WarehouseServer.exe) or by running the console (Wms.WarehouseServerConsole.exe)- As a service: Go to Services in Windows and start the service with name "Boxwise Pro Server"
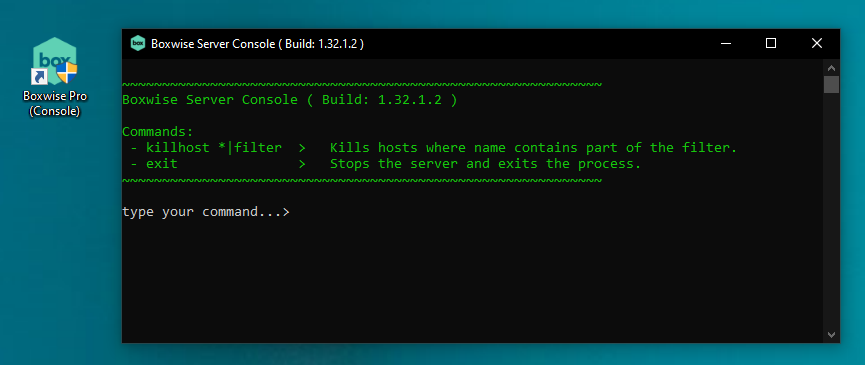
- As a console app: Double click the icon on the desktop or start
Wms.WarehouseServerConsole.exedirectly from the installation folder of boxwise
Running boxwise a service
Running boxwise as a console app
Attach the debugger
- Open your IDE elevated as an administrator. This is needed because the boxwise runs elevated as well.
- Open your project in your IDE (with the code unchanged since the last time you have deployed it).
- For Visual Studio:
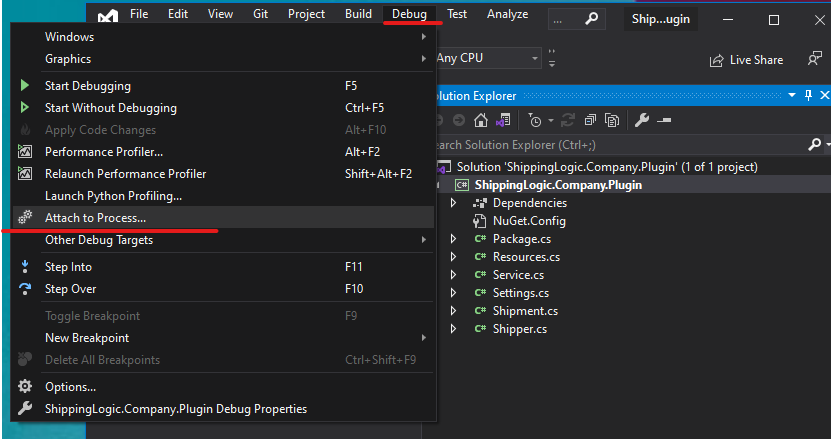
- Click Debug>Attach to Process
- Select either
Wms.WarehouseServer.exeorWms.WarehouseServerConsole.exe - Click Attach
- For Jetbrains Rider:
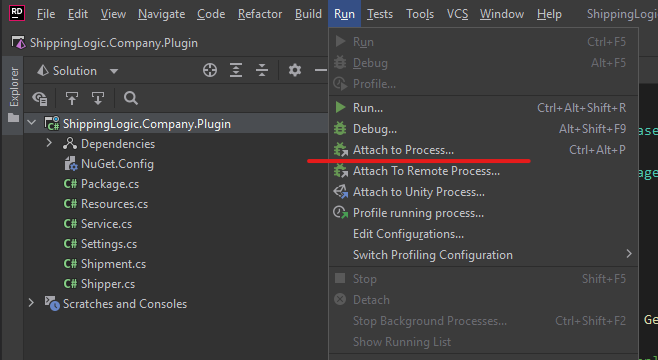
- Click Run>Attach to Process
- Select either
Wms.WarehouseServer.exeorWms.WarehouseServerConsole.exe
- If everything went ok your are now attached to the boxwise process. You can now set your breakpoints in your code and perform the steps in boxwise that will actually make a call to your code (like creating a new shipment or canceling a shipment).
Attaching to a process in Visual Studio 2019
Attaching to a process in Jetbrains Rider
Remote debugging
There is also the option for VS2019 (or higher) and Jetbrains Rider to perform remote debugging. This means you have the source code and IDE running on your development machine and the application running on a remote server. Below the steps needed to perform remote debugging are described for Visual Studio users. For Jetbrains Rider you can use the manual created by Jetbrains here.
Visual Studio
- Install the correct remote tools for your visual studio version on the remote machine
- Start the Remote Debugger as an Administrator (Because boxwise always runs elevated as an Administrator you have to run the Remote Debugger as an Administrator also)
- Make sure you have the address of your remote machine and the port (default port for VS2019 is 4024)
- Make sure the port is open in the firewall(s) in front of your remote machine
- Make sure the deployed Shipping Integration .dll and .pdb belong to the version of your source code (⚠ don't change the source code after deploying!)
- Follow the steps described here in Visual Studio (❗ pls ignore step 9)
- And Happy ❤ Debugging!
Start Remote Debugger as Administrator

Summary
- ✅ You now know that boxwise can either as a console app or as a service
- ✅ You learned how to attach your debugger to boxwise to debug your code
The next step is to learn more about when certain functions are called by boxwise for example. You can read more about this under Reference & Context in the Overview article.